

This Blog is based on 14 months of email discussions following the discovery in Washington State of a new North American record for a species tentatively identified as the European Hygrocybe phaeococcinea discovered by Jen Chandler and pursued by Eric Chandler and Steve Ness (members of the Puget Sound Hygrophoraceae Project) of the North American Mycoflora Project (NAMP).
The discoverers noted that the DNA sequences (ITS barcode) from Washington State and Québec in eastern Canada were similar, but the American sequences were a little over 3% different (divergent) from European sequences. Steve Ness, Jen & Eric Chandler and others in the NAMP group wanted to know if the American population, which they gave the common name of ‘Devil’s Stool’, was a new species. The analyses and discussions below may be helpful to others faced with the question, ‘Is this a new species?’.
In addition, we touch on:
‘How to interpret % divergence/ %match of ITS sequences in GenBank’
‘Adjusting % divergence of sequences for large insertions or deletions’
‘Why we need a phylogenetic analysis instead of a distance tree’
‘What to look for in a phylogenetic analysis of sister species’
‘What do the bootstrap probabilities mean’
You can jump to the embedded topics of interest by clicking on the subjects above. Or, if you have ever wondered ‘Why does it take so long to describe a new species?’, read through this entire Blog.
My initial response to Steve Ness of the Puget Sound Hygrophoraceae NAMP Project follows:
The consensus of opinions from professionals in Europe, and me, is that this is most likely a high latitude or alpine species that has a circumboreal / circumpolar distribution but this is indeed the first record for Western North America. That guess is based partly on the variation in morphology and ITS divergence we have currently, and the known distribution and ecology of the species. This fungus occurs at high latitude and elevation. Other species with this type of distribution and ecology that have been extensively studied are more likely to show genetic interchange between populations on different continents than fungi at lower latitudes. We have found exceptions, however, so this guess is only based on few data and probabilities, and our Canadian collaborators were open to the possibility of a distinct new North American species.
Through further research, Steve and Eric found several other collections made by Renée Lebeuf in Québec, Newfoundland and Nova Scotia. Six of these collections (code HRL) were sent for sequencing.
Is it or isn’t it a new species or variety?
When do we consider describing a new species or variety? It’s complicated. If there are consistent, non-overlapping differences in the ITS (or other gene regions) or morphological characters between populations in different locations, or dissimilar collections from the same location, we start to consider whether they might be different species or varieties. Such differences suggest the populations are not interbreeding at a rate that removes or muddles the differences between them. Species and varieties were traditionally based on morphological (visible to the naked eye or microscopic). My rule of thumb using morphology was that I’d describe a new species if there were at least three independent characters that differed, and a new variety if there were two independent differences. What do I mean by ‘independent’? I would not use the number of sterigmata on basidia and spore dimensions together since two-spored basidia usually produce larger spores than 4-spored basidia, so they are not independent of each other. We now know by comparing divergence in DNA sequences to morphology that there are often indistinguishable species (cryptic or hidden species) embedded in a morphologically-based species concept. Conversely, we know that in groups such as Hygrocybe and Mycena, collections can have different color forms but no apparent difference in DNA sequences. These color forms are best described at the rank of form (rather than variety), but they are good to document at some rank as they can confuse field IDs unless you know they exist.
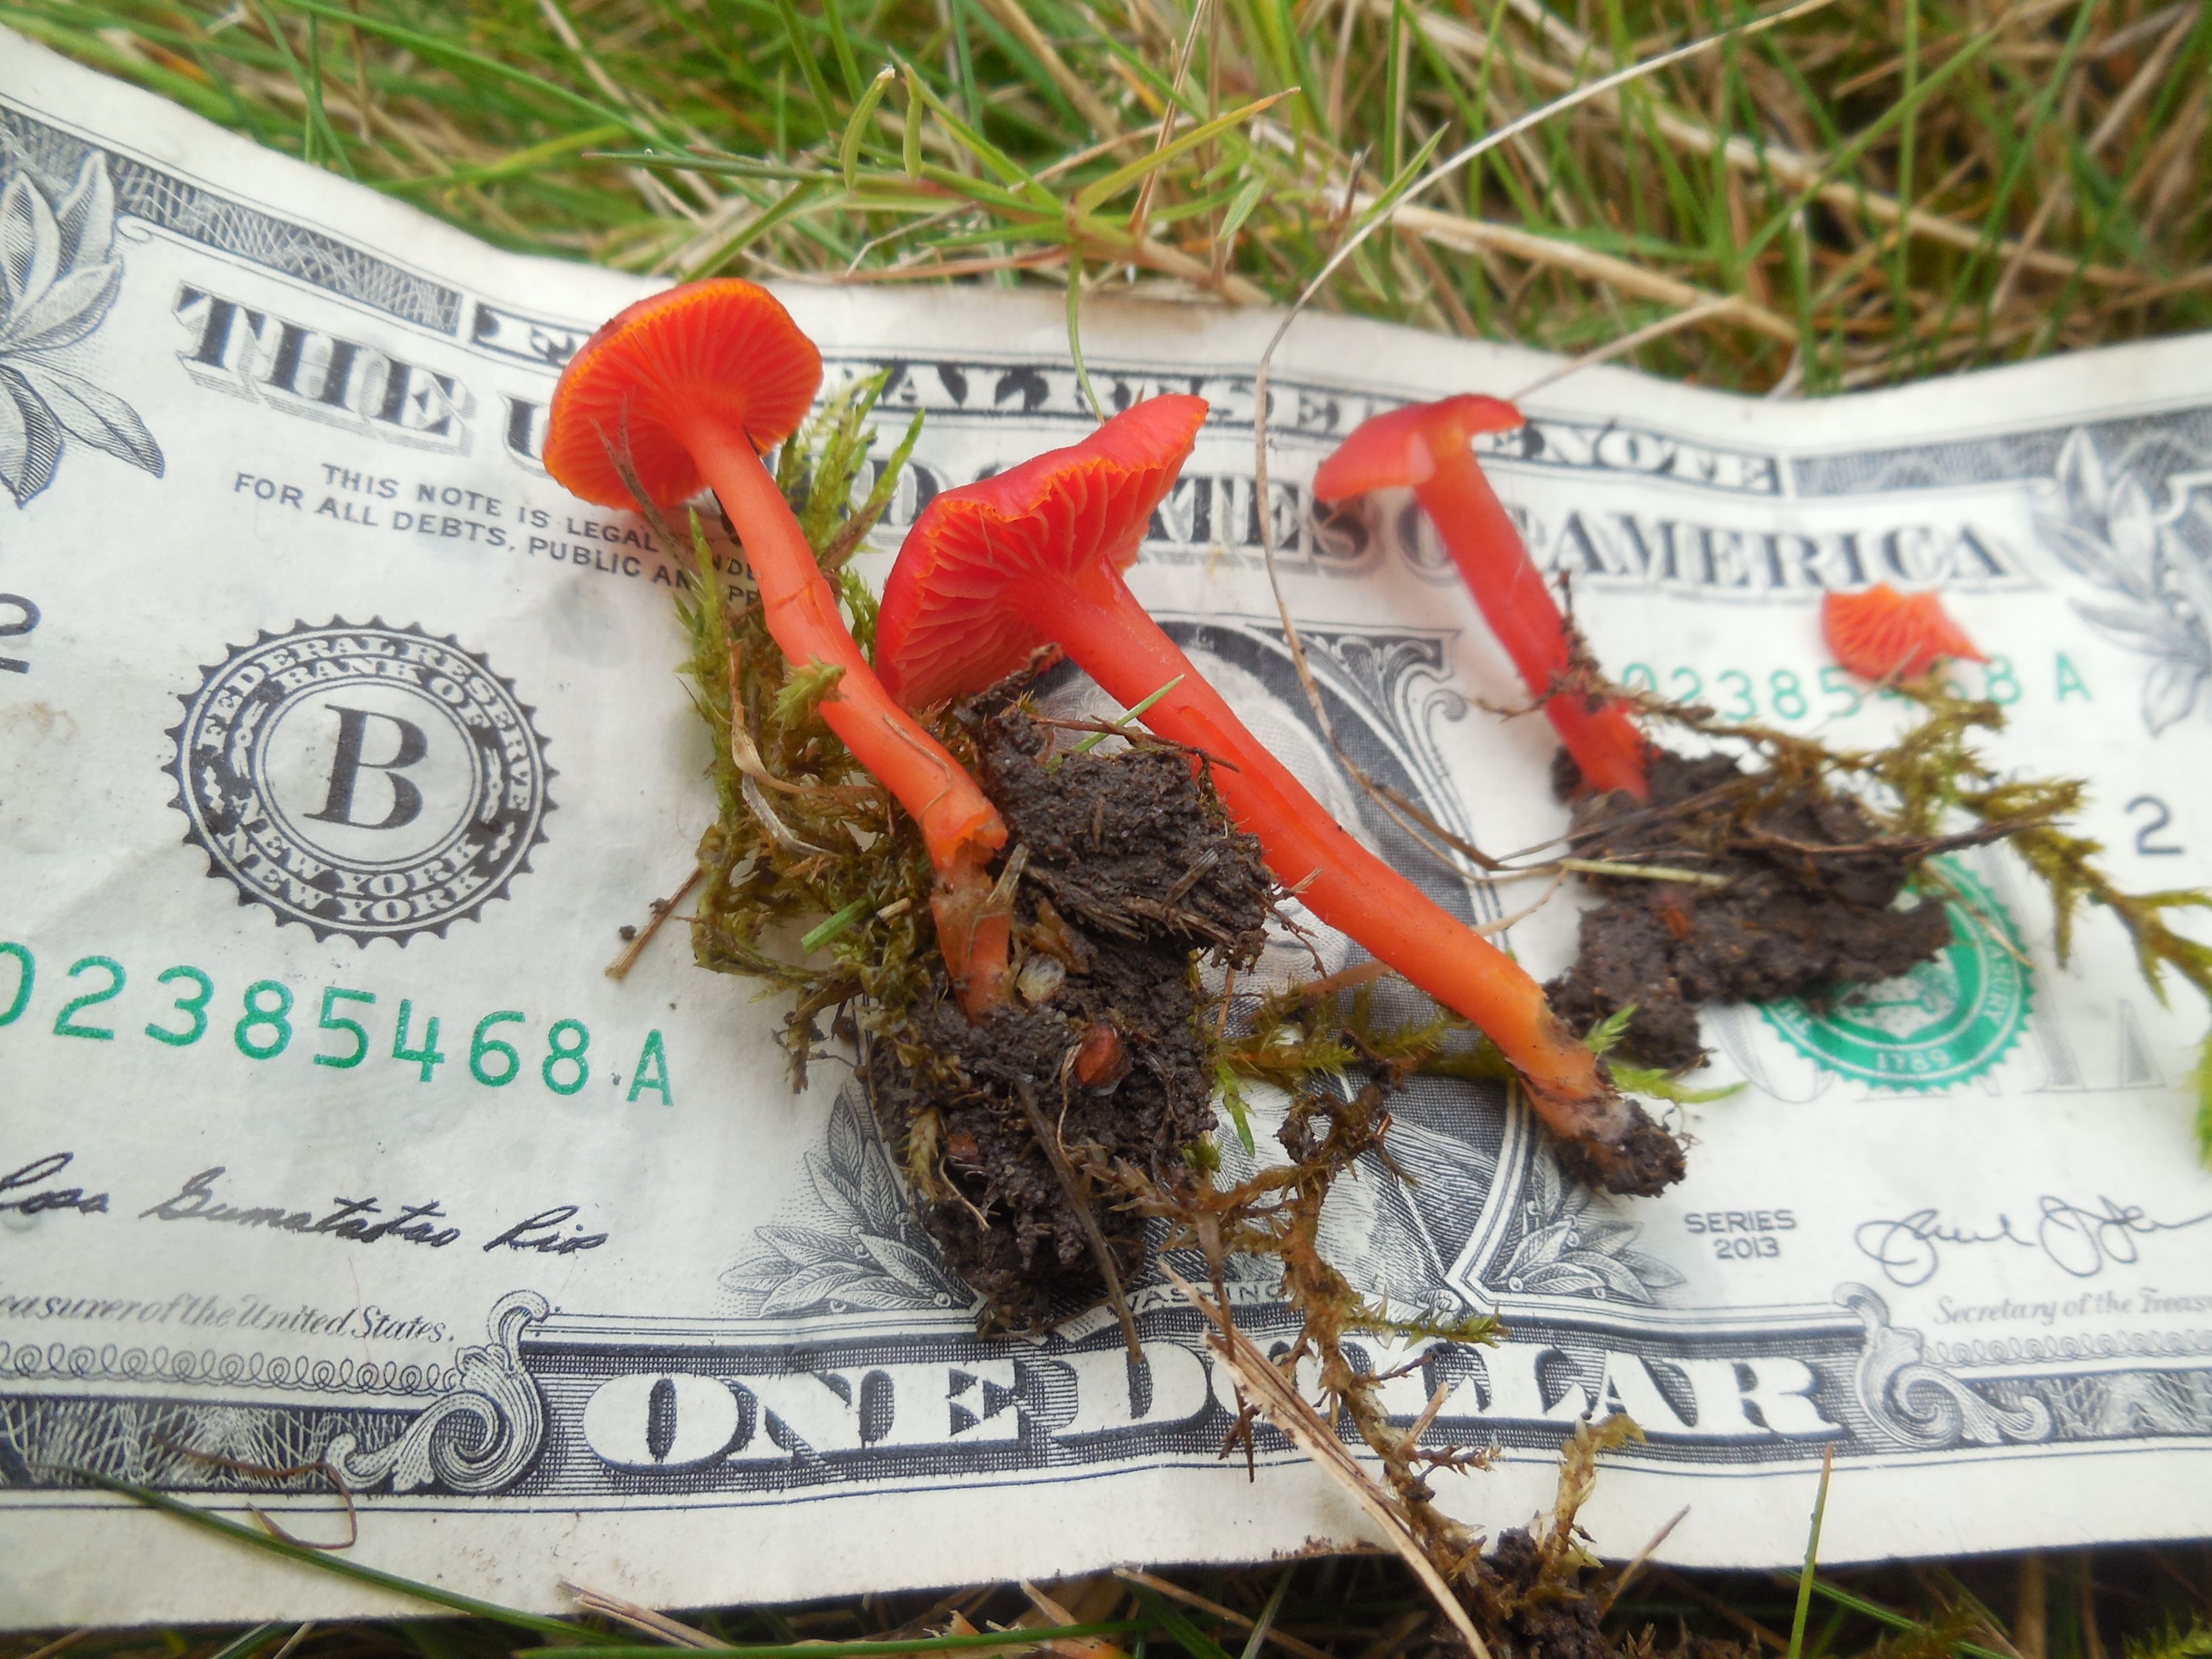
In the case of the Hygrocybe cf. phaeococcinea collection from Washington, there is not a clear macro-appearance difference between collections from Europe and North America. (The ‘cf. between the genus and species name means ‘confer’, meaning the description of that species should be studied as it could apply to the collection). While the first North American collection of H. cf. phaeococcinea from Washington lacks dusky pigments in fresh caps (but it did darken on drying), this color form also appears but is less common in Europe. The Danish expert, David Boertmann, replied to our questions and said there is a lot of variation in color of H. phaeococcinea in Europe, including ones without dusky tints to the cap when it's fresh. The Newfoundland collections of H. phaeococcinea have less dusky tints in the pileus than in Europe - similar to the Puget Sound collection. However, Eric Chandler found a specimen of H. phaeococcinea in Washington State with a blackening cap. Renée Lebeuf with MycoQuébec.org found that some of her collections from Québec Canada that were growing in the open had caps with dusky red pigments compared to ones with brighter red caps in shade. Renée also found no consistent microscopic differences between eastern Canada and Europe. See photos below.
Photos of Hygrocybe phaeococcinea from Québec, Canada by Renée Lebeuf, darkening collection from 2014 on the left, and a non-darkening specimen on the right (HRL0785).


Why do we need a phylogenetic analysis instead of a distance tree?
The difference in the ITS region between England and the Puget Sound collection is small - not generally associated with species differences but borderline, and there can be exceptions if there are clear and consistent breaks that indicate no significant interbreeding occurs between the different populations. The %match that one gets from a GenBank BLAST search and the Distance Tree that can be generated in the GenBank report (see screen capture below) are based on differences between each pair of most similar sequences (pairwise comparison).

Distance tree generated in GenBank based on pair-wise distances between sequences. The sequence that was used in the BLAST search, in this case the ITS sequence of the Washington H. phaeococcinea, will be highlighted in yellow, sometimes, with several matching sequences.
While distance trees are helpful, the question of how species are most likely related to each other via evolution is analyzed using phylogenetic trees & analyses that generate probabilities rather than pairwise divergences between sequences (https://en.wikipedia.org › wiki › Phylogenetic_tree). Jacques Landry of MycoQuébec.org made a phylogenetic tree for H. phaeococcinea, shown below. The Bootstrap support for the branch with North American sequences was low (68%) and the European sequences were not on a separate branch (see below). We want to see bootstrap branch support of at least 75%-80% to have confidence. Percent bootstrap support probabilities are generated by a Monte Carlo Simulation computer program that generates thousands of phylogenetic trees from the same set of DNA sequences and then calculates the probability of the branching pattern at each branch point as a percentage.

After looking at the ITS sequences that were used in the phylogenetic analysis, I realized they were different lengths, and they might not have been trimmed to the same length. If sequences in a phylogenetic analysis are of different lengths, it can alter the results, so I asked Jacques to rerun the analysis twice, trimming one end and both ends. The resulting trees are below.


Trimming one end improved support for the North American branch to 90%, but the European sequences appeared in a grade instead of a grouping called a clade derived from a single branch. Trimming both ends finally gave a phylogenetic tree that had all but one of the European sequences arising from a single branch (but with only 31% support) that was sister to the North American branch (82% support), and that was the topology (form) we were seeking. However, the support for the branch placing the North American and European sequences as sisters had only 48% support (probability that the pattern was consistent and likely real) – not high enough to support separation at species rank. I looked further at the North American and European sequences and found that one of the North American sequences had a European motif in it, while one of the European sequences had an American motif. A motif is a pattern, in this case a distinctive sequence of 8 bases. I suspect this sharing of motifs is the reason for low bootstrap support for the branch separating the North American and European sequences. Jacques noted there was one European sequence apart from the others, and there might be two European species. The subsequent response to Jacques Landry on the separation of North American and European H. phaeococcinea populations follows:
Dear Jacques,
I’m afraid that we would have difficulty concluding that the Europeans have two species because the only branch with significant support is at the base, and the divergences are small.
The deviant RBG Kew specimen is the one that carries a North American motif.
Your suggestion that the taxa are still hybridizing is a logical one, but I did also find a European motif in one of the North American collections, which means there are two viable hypotheses
- That the populations in Europe and North America separated too recently, and there hasn’t been enough time for variation between them to have become ‘fixed’/complete.
- That there is still introgression occurring via rare dispersal events across the Atlantic, which has not allowed the populations to diverge unambiguously.
How to interpret % divergence/ %match of ITS sequences in GenBank?
In the case of H. phaeococcinea, the Puget Sound Washington State sequence (the top record, GenBank MN089485.1) was almost identical (99.49% ident) with a sequence directly below it (MN202583.1) by Andrus Voitk’s collection from Newfoundland in eastern Canada. GenBank shows 96.8% similarity (around 3% divergence) between ITS sequences from England (RBG Kew) and Washington+Newfoundland. Looking at the first part of the GenBank BLAST results for the Washington/ ITS sequence, the Newfoundland MN202583.1 sequence has the highest match of 99.49%, followed by three sequences from England, Royal Botanic Gardens Kew with % ident from 96.82%-95.29%, then an INCREASE in % ident to 98.75% for an environmental sequence from forest floor in Michigan, KC588776.1. The reason the % ident decreases and then increases in this example is that the results are ranked by a complex MaxScore – a measure that many researchers ignore as they don’t find it very useful. The actual match is very good between the Washington State and New England ITS sequences, but the MaxScore is lower because the Michigan sequence is shorter, as is typical for the methods used to generate environmental sequences from soil, litter or roots. Matching environmental sequences are useful as they can help fill out the geographic range of a species.
Screen capture of GenBank BLAST search using ITS sequence of Hygrocybe phaeococcinea from Washington State.

Hitting the line/link for the last match to the New England Environmental Sequence labeled ‘Uncultured fungus clone BOTUC76…..’ gives a view of the alignment between the two sequences. There are only 4 positions in which there is not a match and thus no vertical line.
Alignment of Hygrocybe phaeococcinea and an environmental sequence from New England.

Touching the hot-link for the Accession number on the right for the environmental sequence above, KC588776.1 reveals the information about the source and location of that sample:

The approximate 3% divergence in the ITS barcode between North American sequences and ones from England we found is borderline in separation of fungal species, so we needed a closer look at whether the sequence differences were all independent of each other or not.
Adjusting % divergence of sequences for large insertions or deletions
I recalculated an adjusted % similarity score by looking at the mismatches in the GenBank alignment and counting large mis-matched sections (more than 1 base pair) as only a single change. The reason for doing this is that in such cases there is often only one event that inserted or deleted a number of bases as a group, or other cases where there is an instability that causes something like a stutter (a tandem repeat, such as ATATATAT). In either case, substitutions in a large mis-matched block are likely NOT independent of one another, so the most conservative approach is to count the whole block as a single event (substitution or deletion or insertion).
In this case, I used a sequence from eastern Canada (Newfoundland collection by Andrus Voitk, GenBank MN202583) instead of Washington to compare to a reference sequence from England because they were geographically the closest populations on either side of the hypothesized break. In this case there were two multi-base blocks of mismatches, of which one was 3 and one was 2 bases in length (see GenBank screen capture below). I counted each of these blocks as 1 and recalculated the % divergence between the sequence from the England (Royal Botanic Gardens Kew – RBGKew GenBank EU784335) and the eastern Canada ITS sequence, and it is only 1.8 % different (10 events out of 587 bases in total length). I first omitted a mismatch at either end of the ITS sequences because those are usually sequencing errors - I’d have to go back and look at the original chromatograms to see if they are likely to be errors or real, which depends on how clean the chromatogram was and whether the substitution was in a highly conserved region that almost never has substitutions. If I include those two changes at the ends, the % match only decreases to 98% (12 change events out of 587 bases, only 2% divergence between England and eastern Canada), which is still within the usual 3% range of divergence we see within a species. Steve Russell is working on adding the adjusted % match to MycoMap results, but that will likely take a few years. In the meantime, we have to do the adjusted calculations by hand looking at the pairwise alignment in GenBank (click on the red bar for the closest match, count the number of places where there isn’t a vertical line between the two sequences, and divide by the larger of the two total number of bases listed for the Query (your sequence) at the bottom right (587).

In the end, the North American collections represented Hygrocybe phaeococcinea, not a new species, but the story may continue. There are clearly the beginnings of a genetic separation between North American and European sequences of H. phaeococcinea based on incomplete separation in ITS sequences and the phylogenetic analysis, so despite absence of micromorphology and micromorphology differences between them, the North American population could be described as separate from the European at a rank below species, such as a new variety or subspecies. It depends on whether additional characters separating the populations are discovered (perhaps host or another gene region), and how useful distinguishing these populations are to the users.
Finally, a few final words from a leader in the search for taxonomic identity of the Devil’s stool mushroom
From Eric Chandler, 9 November 2019:
Thanx Jean, Renée, and Jacques for doing this work and results attained, the details of which I only partially understand. However, I do follow the analytical path employed and can clearly see how the conclusions have been reached.
As I've often heard, "The Devil is in the details!". That does fall right in line with the common name we came up with for our favorite red buddy...The Devil's Stool, a.k.a., Hygrocybe phaeococcinea.
From Eric Chandler, 14 December 2019:
Speaking of DNA stuff, for the past two days I have been BLASTing the heck out of DNA sequences acquired thru Steve's efforts. Thank God for the Internet...some of the terminology makes my head spin! However, as with everything else these last 14 months, I am learning, learning, learning, and enjoying every minute of it...wellll, most of the time.
COMMENT BELOW OR ON FACEBOOK Mycoflora 2.0 Discussion Group